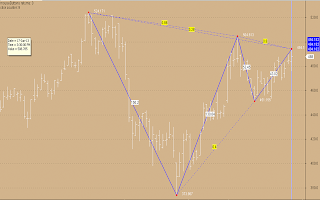
Plot( C, "", colorWhite, styleBar, 0, 0, 0 );
_SECTION_BEGIN("Gartley Tool");
Gartley=ParamToggle("Gartley","OFF|ON",1);
Type=ParamToggle("Label","ABCD|PRICE",1);
Snap=ParamToggle("Snap","Yes|No",1);
if(Gartley==1)
{
SetBarsRequired( -2, -2 );
bi = BarIndex();
bis = SelectedValue( bi );
symbol = Name();
tframe = Interval();
chartID = GetChartID();
Xname = "X" + chartID + symbol + tframe;
Yname = "Y" + chartID + symbol + tframe;
LeftButton = GetCursorMouseButtons() & 1;
a = Nz(StaticVarGet("counter"));
if ( leftButton )
{
StaticVarSet("counter", a+1);
x = GetCursorXPosition( );
y = GetCursorYPosition( );
StaticVarSet( Xname + bis, x );
StaticVarSet( Yname + bis, y );
}
j = 0;
dt = DateTime();
shapePlot = 0;
shapePos = Null;
xx = yy = Null;
for ( i = 0; i <BarCount; i++ )
{
x = StaticVarGet( Xname + i );
y = StaticVarGet( Yname + i );
if ( x == dt[i] AND snap==0)
{
shapePlot[i] = 1;
shapePos[i] = IIf(abs(H[i]-y) < abs(L[i]-y), H[i], L[i]);
xx[j] = i;
yy[j] = IIf(abs(H[i]-y) < abs(L[i]-y), H[i], L[i]);
j++;
}
else if ( x == dt[i] AND snap==1)
{
shapePlot[i] = 1;
shapePos[i] = y;
xx[j] = i;
yy[j] = y;
j++;
}
}
shape = shapeSmallCircle;
PlotShapes( shapePlot*shape, colorRed, 0, shapePos, 0 );
Values=ParamToggle("Segment Values","No|Yes",1);
vr=ParamToggle("R1","No|Yes",1);
vr2=ParamToggle("R2","No|Yes",0);
vr3=ParamToggle("R3","No|Yes",1);
for ( i = 1; i <= j ; i++ )
{
if(i==1 AND Type==0)
{
PlotText("X ",xx[i-1]-2,yy[i-1],colorWhite);
}
if(i==2 AND Type==0)
{
PlotText("A ",xx[i-1]-2,yy[i-1],colorWhite);
}
if(i==3 AND Type==0)
{
PlotText("B ",xx[i-1]-2,yy[i-1],colorWhite);
}
if(i==4 AND Type==0)
{
PlotText("C ",xx[i-1]+2,yy[i-1],colorWhite);
}
if(i==5 AND Type==0)
{
PlotText("D ",xx[i-1]+2,yy[i-1],colorWhite);
}
if(i==6 AND Type==0)
{
PlotText("E ",xx[i-1]+2,yy[i-1],colorWhite);
}
if(i==7 AND Type==0)
{
PlotText("F ",xx[i-1]+2,yy[i-1],colorWhite);
}
if(i==8 AND Type==0)
{
PlotText("G ",xx[i-1]+2,yy[i-1],colorWhite);
}
if(Type==1)
{
PlotText(""+yy[i-1],xx[i-1]+2,yy[i-1],colorWhite);
}
Plot( LineArray( xx[i-1], yy[i-1], xx[i], yy[i] ), "", colorBlue, styleThick );
XA=yy[i]-yy[i-1];
AB=yy[i]-yy[i+1];
BC=yy[i+1]-yy[i+2];
CD=yy[i+2]-yy[i+3];
r=CD/XA;
r2=AB/XA;
r3=XA/BC;
if(vr==1)
{
PlotText(""+Prec(abs(r2), 2 ),XX[i-1]+int((xx[i+1]-XX[i-1])/2),yy[i-1]+((yy[i+1]-yy[i-1])/2),colorBlack,colorYellow);
Plot( LineArray( xx[i-1], yy[i-1], xx[i+1], yy[i+1] ), "", colorBlue, styleDashed );
}
if(vr2==1)
{
PlotText(""+Prec(abs(r3), 2 ),XX[i-1]+int((xx[i+2]-XX[i-1])/2),yy[i-1]+((yy[i+2]-yy[i-1])/2),colorBlack,colorYellow);
Plot( LineArray( xx[i-1], yy[i-1], xx[i+2], yy[i+2] ), "", colorBlue, styleDashed );
}
if(vr3==1)
{
PlotText(""+Prec(abs(r), 2 ),XX[i-1]+int((xx[i+3]-XX[i-1])/2),yy[i-1]+((yy[i+3]-yy[i-1])/2),colorBlack,colorYellow);
Plot( LineArray( xx[i-1], yy[i-1], xx[i+3], yy[i+3] ), "", colorBlue, styleDashed );
}
if(Values==1)
{
PlotText(""+Prec(abs(XA), 2 ),XX[i-1]+int((xx[i]-xx[i-1])/2),yy[i-1]+XA/2,colorBlack,colorWhite);
}
}
if ( GetCursorMouseButtons() == 12 )
{
for ( i = 0; i < BarCount; i++ )
{
StaticVarRemove("counter");
StaticVarRemove( Xname + i );
StaticVarRemove( Yname + i );
RequestTimedRefresh(1,True );
}
}
Title = "mouseButtons returns: " + (GetCursorMouseButtons()) + "\nclick counter: " + StaticVarGet("counter");
}
_SECTION_END();
